
Brigitte Kolver
Recruitment Consultant at Prosple
Explore key emerging trends that are profoundly influencing the landscape of the New Zealand graduate industry in 2023.

Applications are up significantly year on year
Applications are up significantly year on year
We are pleased to report a surge of 17% in the number of applications received through Prosple New Zealand, which is highly encouraging, considering the challenging circumstances of the previous year.
Total job applications
Total job applications
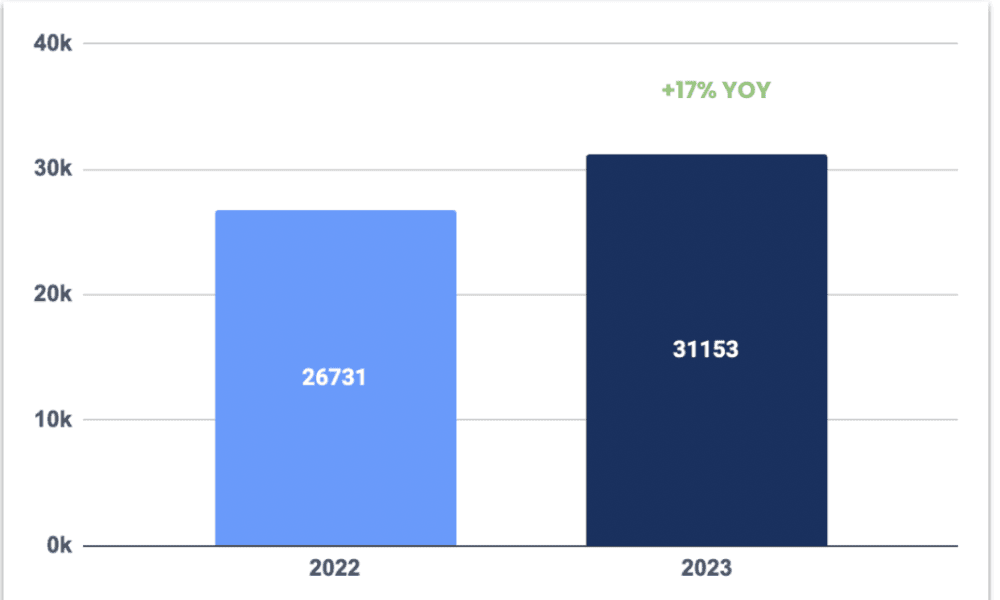
Last year we observed that students were applying to fewer jobs as they noticed there were more employers hiring more graduates than in previous years. As a result, they were being very ‘picky’ when selecting where they were applying. This year's increase in application numbers could be a number of factors, however, our early hypothesis is that students are aware of the state of the kiwi economy. Headlines such as ‘Amazon to cut 18,000 jobs’ invokes fear in the job market, which means that students are more likely to apply for more opportunities.
So what is driving the change?
So what is driving the change?
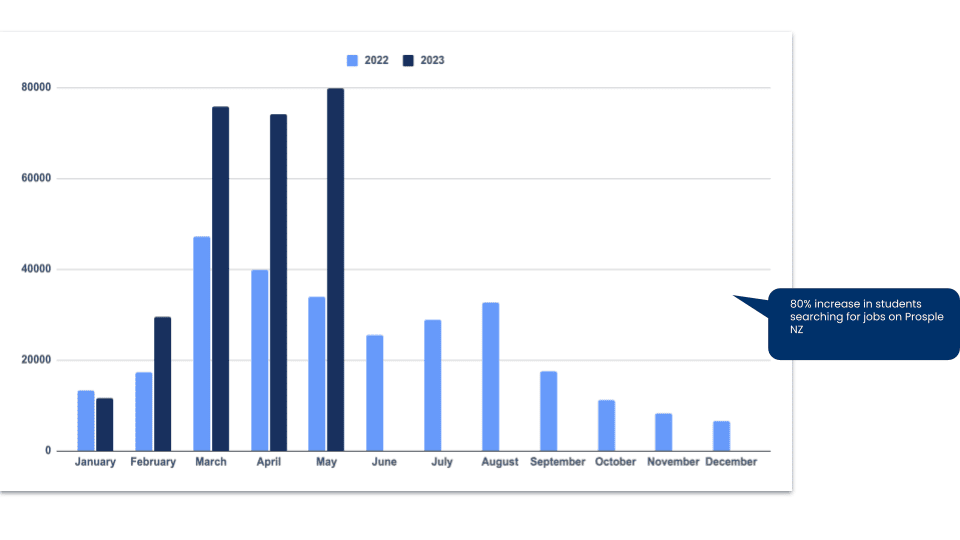
Put simply, students are searching and applying for more jobs this year. This heightened activity commenced during the primary recruitment season in March and has maintained a consistent level ever since, reflecting an 80% increase compared to the corresponding period last year
The proportion of applications made to each sector
The proportion of applications made to each sector
Interestingly, not every sector has seen the fruits of this application boom, with some industries becoming more popular than others among students.
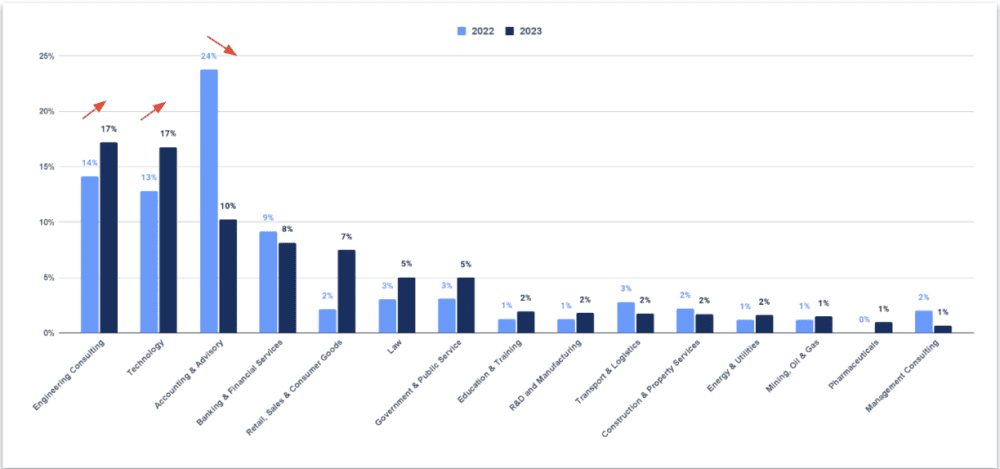
It is worth noting that the aforementioned increase in application numbers does not uniformly apply to all sectors. Notably, there are intriguing trends regarding the proportionate impact within each sector. While the accounting sector has experienced a significant decline, sectors such as law, government, and engineering consulting have witnessed substantial growth. Particularly noteworthy is the technology sector, which has observed a remarkable 4% increase compared to the previous year.
Business students are more diverse in where they are applying; Engineering and IT students are conversely more narrow in their applications
Business students are more diverse in where they are applying; Engineering and IT students are conversely more narrow in their applications
The recent trends have unveiled interesting shifts in the preferences and application patterns of different student cohorts.
Business application proportions
Business application proportions
There has been a shift in the preferences of business students, with a growing interest in the technology and financial services industries.
Information Technology application proportions
Information Technology application proportions
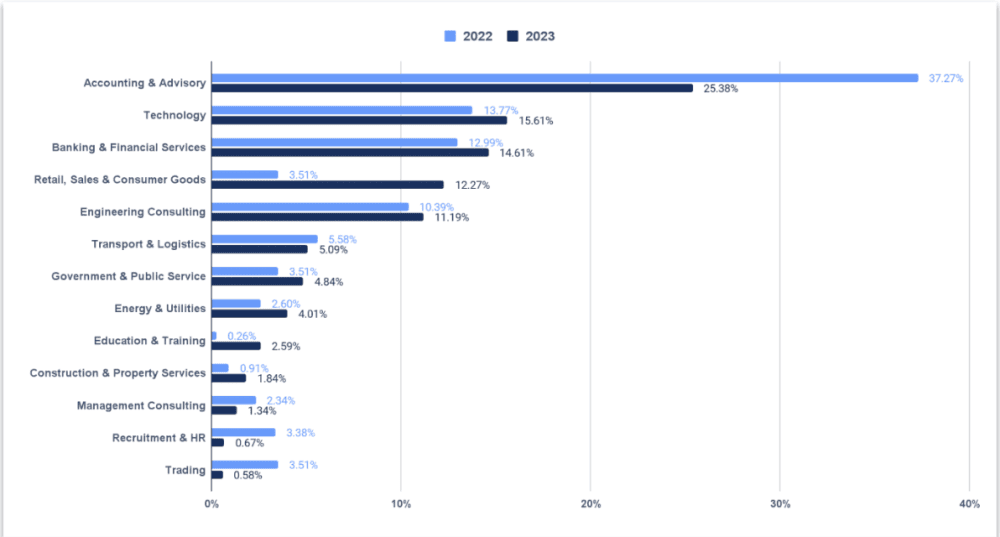
When looking at IT & Computer Science students, it becomes apparent that the majority of their applications are within the tech sector. Additionally, it is interesting to note that applications from IT students have increased across every sector except for Accounting & Advisory and Banking, where significant decreases have been observed.
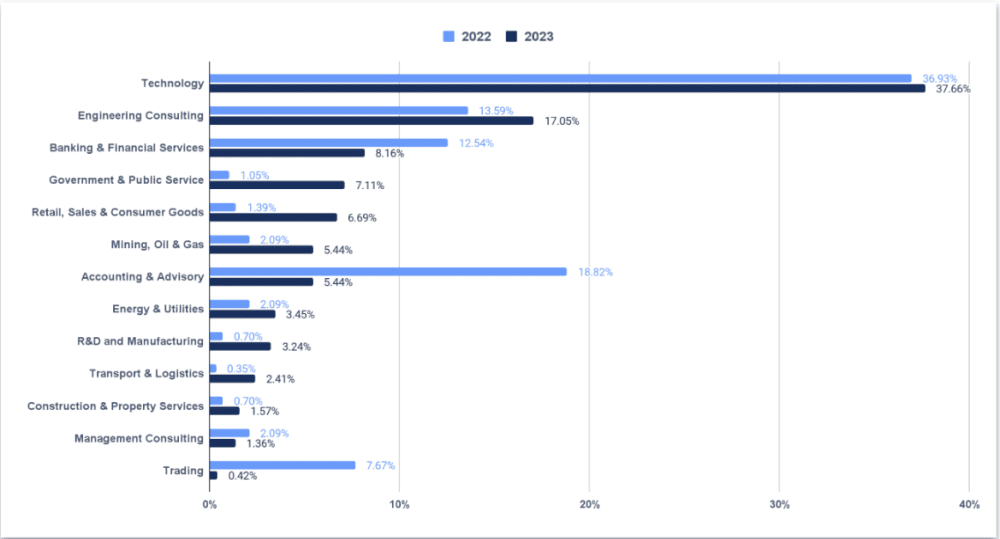
Engineering application proportions
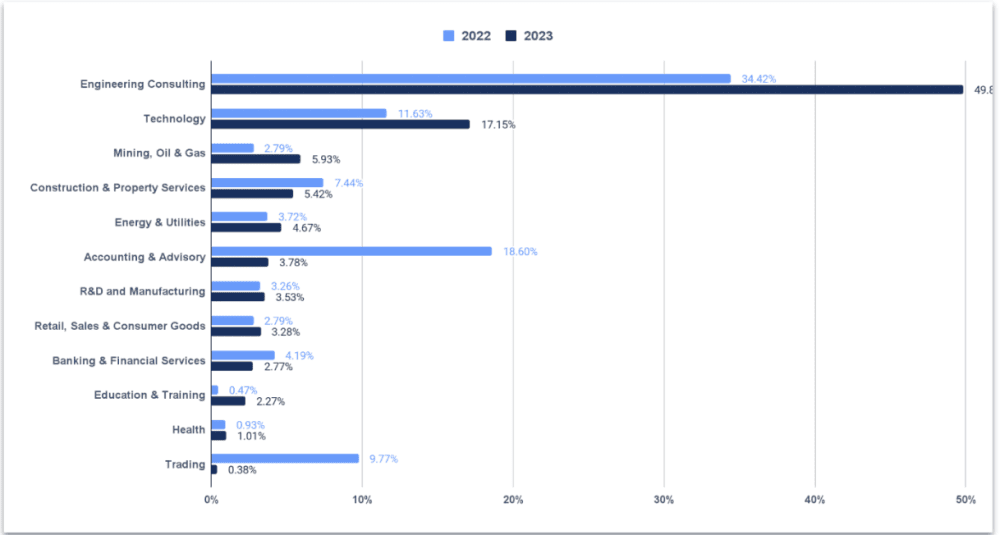
Engineering application proportions
We can see a clear preference among the engineering cohort for working in engineering consulting. Additionally, the technology sector is also a favourite among engineering students, and there has been an increase in applications compared to last year.
Have we seen the ‘peak’ in university education in Aoteroa?
Have we seen the ‘peak’ in university education in Aoteroa?
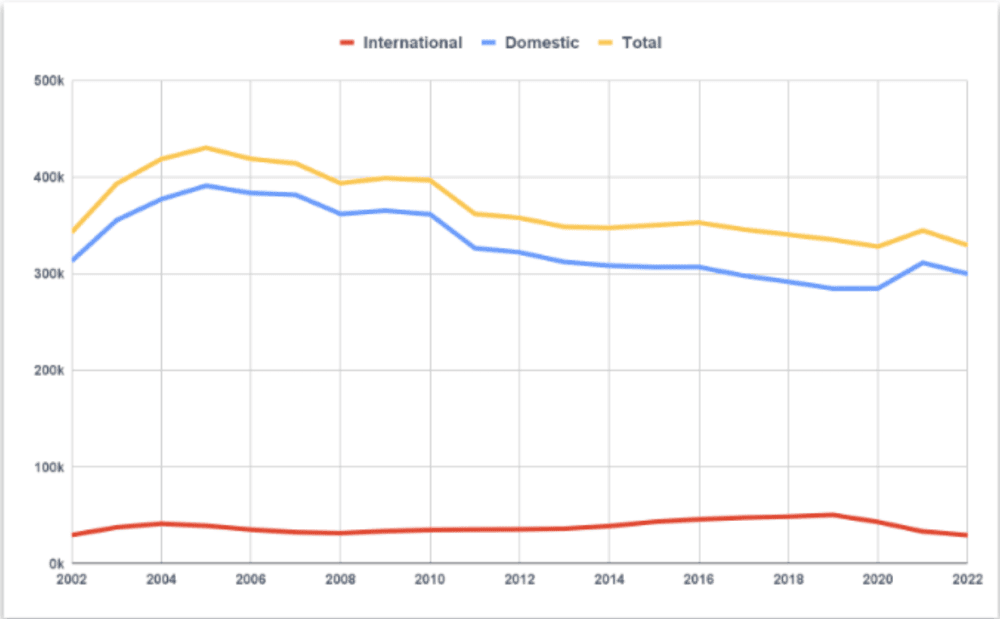
Overall we’ve seen a steady decline in students commencing studies in NZ since 2010, which would suggest the answer is yes. In 2005 we saw 430,600 students commence their university studies. In 2022, that dipped to 329,690, which is a 23% decrease.
Management & Commerce commencements and graduations are declining
Management & Commerce commencements and graduations are declining
There’s been a steady decline in the number of students commencing their management and commerce degrees, which is a worrying trend for employers such as Accounting & Advisory firms who rely on recruiting these students.
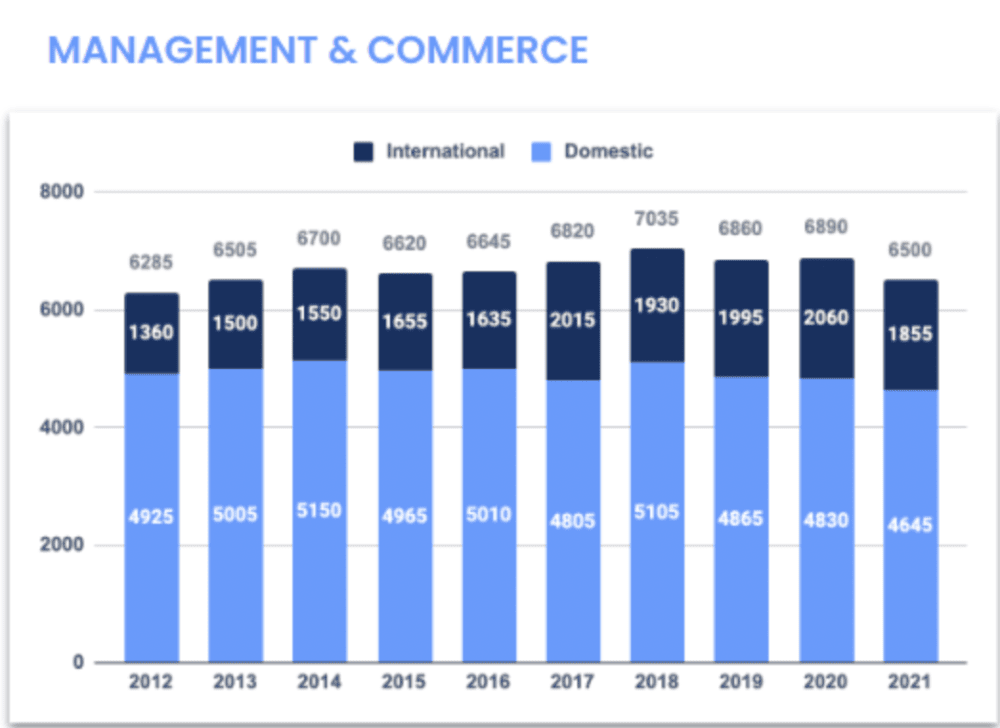
Whilst there’s been a decline in the number of business students commencing their studies, interestingly there’s still the same number of students completing their business studies over the past 10 years.

There are more Māori and Pasifika students completing their studies
There are more Māori and Pasifika students completing their studies
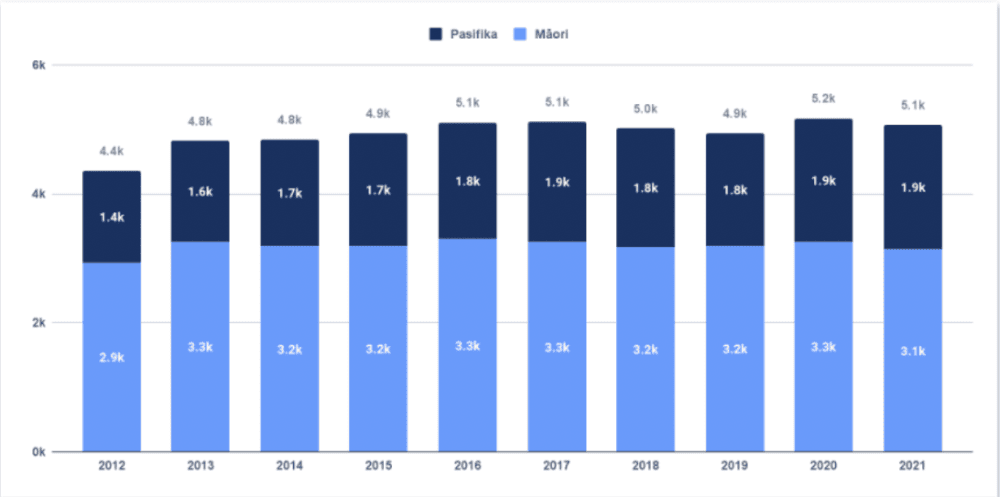
Whilst there are fewer Māori and Pasifika students commencing their studies, there are more completing their degrees which is a great sign! In 2012 there were 4,355 Māori and Pasifika students completing their studies, in 2021 which grew to 5,070, a 16% increase in the last decade.
However there is still an education gap
However there is still an education gap
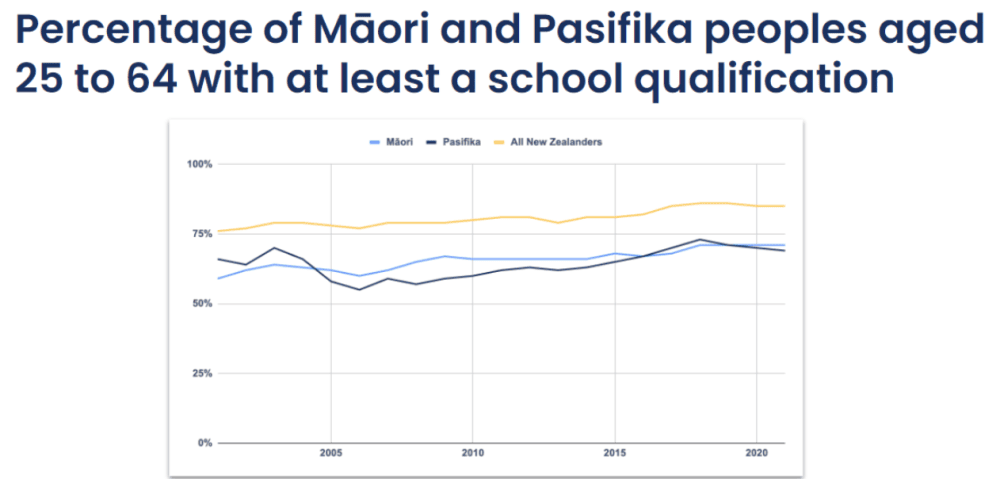
There are Māori and Pacific people who are gaining at least a school qualification, the education gap remains.
Tips for responding to these trends
Tips for responding to these trends
In response to the identified trends and to remain competitive in hiring ideal graduate talent, major employers should consider the following tips:
Improve Salary Offerings and Descriptions: With the increasing competition for top talent, it is crucial for employers to offer competitive salaries. Additionally, employers should effectively communicate the attractiveness of their salary packages, highlighting any additional benefits and incentives. Ensuring that salary information is clear, transparent, and appealing can help attract and retain sought-after graduates.
Craft Compelling Job Descriptions: To stand out among other employers, it is essential to create job descriptions that resonate with Gen-Z students. Employers should use language and content that align with the values and aspirations of this generation. Highlighting opportunities for growth, innovation, and purpose-driven work can make job descriptions more appealing. Furthermore, employers should optimize their presence on graduate jobs boards and social media platforms, where students actively search for opportunities.
Consider Timing and Visibility: While March tends to be the busiest time for graduate recruitment, employers should reassess if it is necessary to limit their visibility to this period. Expanding recruitment efforts throughout the year and being visible during off-peak times can help capture the attention of students who may not be following the traditional recruitment schedule. This flexibility can give employers an advantage in attracting top talent.
Expand Candidate Pool: To address the skill shortages and fulfil demand, employers should consider broadening their candidate pool beyond university students. This includes exploring opportunities to engage with students from alternative education pathways and considering international students who bring diverse perspectives and skills. Expanding the candidate pool can enhance the talent pipeline and provide access to a wider range of qualified candidates.
Plan Early and Strategically: To proactively address future talent challenges, such as increased demand for technology skills or declining enrollment in certain fields, employers should develop long-term engagement plans. This involves not only planning for the next recruitment campaign but also anticipating future talent needs and adapting strategies accordingly. By staying ahead of the curve and actively responding to changing market dynamics, employers can ensure they have the right talent in place when it's needed.
Summary
Understanding the current trends and preferences among graduates is vital for employers to effectively navigate the competitive graduate recruitment landscape. By adapting current strategies and responding to these trends, you can increase your chance of attracting and securing the top talent they need to drive your organisation forward.
If your organisation is looking to increase its employer branding to attract more applications, book a strategy session with one of our Graduate Attraction Consultants today.
The slide deck and the webinar
The slide deck and the webinar
Visualisations of all data discussed are available in this slide deck that was shared in the webinar. Further data on other student cohorts can also be found in these slides:

